
Articles and News


Finding New Rich Customers: The Long Tail Of Ultra-High Net Worth (UHNW) | August 01, 2014 (0 comments)

New York, NY—More wealthy customers are in your back yard than you may realize.
Conventional wisdom says global capitals are the hangouts for Ultra-High Net Worth (UHNWs) individuals and their families. UHNWs are defined as those with net worth of $30 million+. Certainly, these are places many of them travel with some frequency. I’ve recently been speaking to a number of big players in New York real estate, and while they say the buyers at the high end of the market come from Iowa to Indonesia, they stay less, and they live a global private jet lifestyle.
We also know that seasonally you can find a cross-section of the super rich in Sardinia, St. Barth’s and Aspen. Then, at other times of year, you will find UHNWs over-concentrated in Davos, Augusta, Louisville, Ft. Lauderdale, Monte Carlo, Indianapolis, Flushing, or the rotating sites for The Super Bowl, PGA Championship, British Open, and so forth. In varying years you can find the super-rich flocking to the Olympics, Ryder Cup, America’s Cup, and FIFA World Cup.
The annual General Assembly of the United Nations brings extra UHNWs to New York. Some of the UHNWs who today and tomorrow may be in Pinehurst could next week be in San Antonio, and in coming weeks at any of several cities across Brazil. Others will be in the London suburb of Wimbledon. Others may be simply unwinding anywhere in one of their houses from Maui to the Hamptons, Cannes, or even Door County. (By the way, Door County is in Wisconsin, and million dollar homes are quite common there, as I came to know when a reader of Elite Traveler bought a $29 million home that was advertised in the magazine.)
Wealth-X produces some interesting research about UHNWs. Their latest report, in conjunction with UBS, breaks out the home base of the very, very rich, by country, and in the United States, by state. If each American state were a country, California would have the third largest UHNW population in the world behind Germany and Japan.
On this basis, the Top 10 goes as follows: United Kingdom, China, New York, India, Switzerland, Texas, and Canada. Places 11 through 20 are France, Florida, Brazil, Mexico, Hong Kong, Illinois, Italy, Michigan, Spain, and Pennsylvania. These 20 areas represent 67% of the 193,685 UHNWs Wealth-X had identified.
Now things get tricky. The next 121 countries, states and combination of countries listed as “other” in the report are home base for fully 33 percent of the world’s richest families. For example, there are more UHNW families in Minnesota than Russia. North Carolina has more super-rich than the United Arab Emirates. Kentucky, Alabama and Montana each have more UHNWs than Qatar. Colorado, Arizona and Tennessee each have larger super-rich populations than Turkey, Malaysia or South Africa. So much for emerging economies! (See my analysis below.)
The payoff of attracting super-rich families for luxury providers is huge. The Top 0.1% of U.S. taxpayers (some 117,000 households) is estimated to have spent $214 billion last year on high-end purchases such as watches, jewelry, and fashion, as well as stays at hotels and resorts, spas and villas.
Yet clearly, at any one time the super-rich are in many different places. For example, St. Barth’s only has about 300 villas and 200 hotel rooms. Add several dozen mega-yachts but even at peak times, there is only a very small fraction of UHNWs represented. It’s the same with events such as the Super Bowl, Art Basel Miami, and the Kentucky Derby, where private jet arrivals usually range between 500 and 1,000.
What does this mean for companies that want to tap into the high spending super-rich? To tap into the long tail, luxury providers need to find media that is in many places at once. In fact, even in the Top 20 that make up two-thirds of UHNWs, places such as Ohio, Michigan, and Pennsylvania are rarely mentioned as target areas by luxury marketers. Back to Door County. There are more UHNW families in Wisconsin than Saudi Arabia.
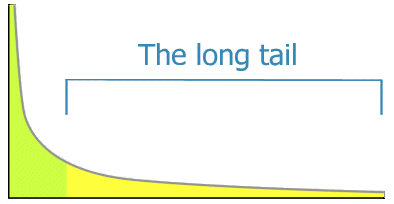
In statistics, the long tail is the portion of the distribution having a large number of occurrences far from the "head" or central part of the distribution. (Wikipedia)
Global UHNW Population by Geography:
| Ranking | Geography | UNHW Population | % of Global UHNW |
| 1. | Germany | 17,820 | 9.20% |
| 2. | Japan | 14,270 | 7.37% |
| 3. | California | 12, 560 | 6.48% |
| 4. | United Kingdom | 10,910 | 5.63% |
| 5. | China | 10,675 |
5.51% |
| 6. | New York | 8,945 | 4.62% |
| 7. | India | 7,850 | 4.05% |
| 8. | Switzerland | 6,330 | 3.27% |
| 9. | Texas | 6,285 | 3.24% |
| 10. | Canada | 4,980 | 2.57% |
| 11. | France | 4,490 | 2.32% |
| 12. | Florida | 4,215 | 2.18% |
| 13. | Brazil | 4,015 | 2.07% |
| 14. | Mexico | 3,365 | 1.74% |
| 15. | Hong Kong | 3,180 | 1.64% |
| 16. | Illinois | 2,770 | 1.07% |
| 17. | Italy | 2,075 | 1.07% |
| 18. | Michigan | 1,920 | 0.99% |
| 19. | Spain | 1,625 | 0.84% |
| 20. | Pennsylvania | 1,570 | 0.81% |
| 21. | Ohio | 1,455 | 0.75% |
| 22. | Norway | 1,450 | 0.75% |
| 23. | Rest of Latin America | 1,415 | 0.73% |
| 24. | South Korea | 1,390 | 0.72% |
| 25. | Wisconsin | 1,370 | 0.71% |
| 26. | Saudi Arabia | 1,360 | 0.70% |
| 27. | Singapore | 1,355 | 0.70% |
| 28. | Massachusetts | 1,345 | 0.69% |
| 29. | Connecticut | 1,330 | 0.69% |
| 30. | Netherlands | 1,290 | 0.67% |
| 31. | Maryland | 1,280 | 0.66% |
| 32. | Virginia | 1,250 | 0.65% |
| 33. | Taiwan | 1,245 | 0.64% |
| 34. | Minnesota | 1,240 | 0.64% |
| 35. | New Jersey | 1,235 | 0.64% |
| 36. | Washington | 1,190 | 0.61% |
| 37. | Russia | 1, 180 | 0.61% |
| 38. | North Carolina | 1,135 | 0.59% |
| 39. | Georgia | 1, 125 | 0.58% |
| 40. | Argentina | 1,110 | 0.57% |
| 41. | Colorado | 1,085 | 0.56% |
| 42. | Sweden | 1,070 | 0.55% |
| 43. | Tennessee | 1,050 | 0.54% |
| 44. | United Arab Emirates | 1,050 | 0.54% |
| 45. | Indiana | 1,030 | 0.53% |
| 46. | Arizona | 970 | 0.50% |
| 47. | Turkey | 900 | 0.46% |
| 48. | Oklahoma | 890 | 0.46% |
| 49. | Portugal | 870 | 0.45% |
| 50. | Indonesia | 865 | 0.45% |
| 51. | Kuwait | 845 | 0.44% |
| 52. | Malaysia | 840 | 0.43% |
| 53. | Belgium | 810 | 0.42% |
| 54. | Missouri | 800 | 0.41% |
| 55. | Poland | 800 | 0.41% |
| 56. | South Africa | 775 | 0.40% |
| 57. | Denmark | 740 | 0.38% |
| 58. | Thailand | 720 | 0.37% |
| 59. | Luxembourg | 660 | 0.34% |
| 60. | Philippines | 660 | 0.34% |
| 61. | Colombia | 635 | 0.33% |
| 62. | Nigeria | 600 | 0.31% |
| 63. | Ireland | 580 | 0.30% |
| 64. | Austria | 565 | 0.29% |
| 65. | Kansas | 550 | 0.28% |
| 66. | Arkansas | 550 | 0.28% |
| 67. | Rest of Middle East | 550 | 0.28% |
| 68. | Chile | 515 | 0.27% |
| 69. | Egypt | 510 | 0.26% |
| 70. | Greece | 505 | 0.26% |
| 71. | Nevada | 500 | 0.26% |
| 72. | District of Columbia | 500 | 0.26% |
| 73. | Peru | 470 | 0.24% |
| 74. | Ukraine | 440 | 0.23% |
| 75. | Venezuela | 435 | 0.22% |
| 76. | Pakistan | 415 | 0.21% |
| 77. | Oregon | 410 | 0.21% |
| 78. | Louisiana | 400 | 0.21% |
| 79. | Hungary | 400 | 0.21% |
| 80. | Finland | 400 | 0.21% |
| 81. | Kentucky | 385 | 0.20% |
| 82. | Alabama | 380 | 0.20% |
| 83. | South Carolina | 365 | 0.19% |
| 84. | Israel | 360 | 0.19% |
| 85. | Montana | 355 | 0.18% |
| 86. | Qatar | 345 | 0.18% |
| 87. | Rest of Asia | 320 | 0.17% |
| 89. | Mississippi | 295 | 0.15% |
| 90. | Nebraska | 295 | 0.15% |
| 91. | Croatia | 280 | 0.14% |
| 92. | Czech Republic | 280 | 0.14% |
| 93. | Rhode Island | 265 | 0.14% |
| 94. | Eduador | 265 | 0.14% |
| 95. | Rest of Africa | 255 | 0.13% |
| 96. | Dominican Republic | 250 | 0.13% |
| 97. | Guatemala | 245 | 0.13% |
| 98. | Utah | 225 | 0.12% |
| 99. | Hawaii | 215 | 0.11% |
| 100. | Honduras | 215 | 0.11% |
| 101. | Iowa | 210 | 0.11% |
| 102. | West Virginia | 205 | 0.11% |
| 103. | Bolivia | 205 | 0.11% |
| 104. | Syria | 205 | 0.11% |
| 105. | Nicaragua | 200 | 0.10% |
| 106. | Vietnam | 195 | 0.10% |
| 107. | Idaho | 190 | 0.10% |
| 108. | New Hampshire | 185 | 0.10% |
| 109. | Paraguay | 175 | 0.09% |
| 110. | Iraq | 175 | 0.09% |
| 111. | Lebanon | 155 | 0.08% |
| 112. | Kenya | 155 | 0.08% |
| 113. | South Dakota | 150 | 0.08% |
| 114. | El Salvador | 150 | 0.08% |
| 115. | Oman | 150 | 0.08% |
| 116. | New Mexico | 130 | 0.07% |
| 117. | Kazakhstan | 130 | 0.07% |
| 118. | Vermont | 125 | 0.06% |
| 119. | Uruguay | 120 | 0.06% |
| 120. | Panama | 115 | 0.06% |
| 121. | Tanzania | 115 | 0.06% |
| 122. | Angola | 110 | 0.06% |
| 123. | Puerto Rico | 105 | 0.05% |
| 124. | Bahrain | 105 | 0.05% |
| 125. | Costa Rica | 100 | 0.05% |
| 126. | Bangladesh | 90 | 0.05% |
| 127. | Maine | 85 | 0.04% |
| 128. | Uzbekistan | 85 | 0.04% |
| 129. | Sri Lanka | 75 | 0.04% |
| 130. | North Dakota | 70 | 0.04% |
| 131. | Azerbaijan | 65 | 0.03% |
| 132. | Libya | 65 | 0.03% |
| 133. | Tunisia | 65 | 0.03% |
| 134. | Delaware | 55 | 0.03% |
| 135. | Ethiopia | 55 | 0.03% |
| 136. | Alaska | 50 | 0.03% |
| 137/138 | Tajikistan/Cuba | 45 each | 0.02% each |
| 139 | Mongolia | 35 | 0.02% |
| 140/141 | Algeria/Morocco | 35 each | 0.02% each |
Source: Wealth-X
Doug Gollan is editor-in-chief and group president of Elite Traveler, the only audited (by BPA Worldwide) publication delivered to global locations for private jet travelers. We have global distribution in over 100 countries aboard private jets and in private jet terminals. Each issue is read by over 630,000 Ultra Affluent consumers with an Average Household Income of $5.3 million (Source: Prince & Associates, 2011)