
Articles and News


Future Growth Projections: Your Roadmap To Meeting Your Sales And Profit Goals | October 31, 2018 (0 comments)

Omaha, NE—Last month, we discussed focusing on the key measures of your business. This article will help you to create a roadmap so that you can measure your progress towards your sales and profit goals. It is important to achieve your future wealth and retirement goals.
Related: Focus On All The Key Measures Of Your Business
Monthly Sales Analysis. Following our example of ‘GAP’ Sales of $1,062,265, we now need to break the annual budget down into realistic monthly targets. Because not all months are created equally, we need to divide the annual budget into relevant ‘seasonal’ proportions. For example, December sales for most stores represents between 20-22% of total annual sales whereas other months can be as low as 5%. We suggest you look over at least three (3) years' sales history trends to help even out any exceptional highs or lows. See Table 1 below:
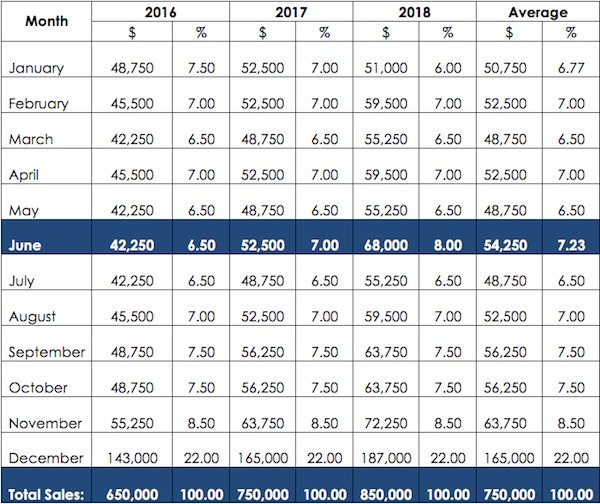
In this table, you will notice that for the month of June (highlighted), sales have ranged from 6.5% in 2016 to 8% in 2018 with the average being 7.23%. Therefore, if the average June contributes 7.23% of total sales then your budget for next June would be $76,802 i.e. 7.23% of $1,062,265 equals $76,802.
If you do not have history going back this far, then either go back as far as you can and draw your own conclusions or use the Industry averages. Please take into account any months with unusual trading patterns such as sale months, closed for remodeling, etc. as these can distort the normal seasonal breakdown.
Daily Sales Analysis. We would also suggest breaking the monthly goal into a Daily Goal. The easiest way to do this is simply to divide the total sales goal by the number of trading/selling days. For example, if the budget for June is $76,802 and your store is open for 25 days, then your daily budget is $3,072; i.e., $76,802 divided by 25 days equals $3,072 per day. Table 2 below shows what a monthly breakdown might look like:
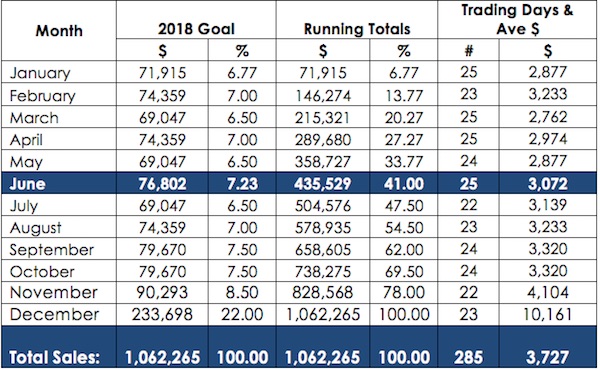
If you want to strive for ‘Best Practice’ then your daily goal can be broken down between the sales team. For example, if Mary typically does 25% of the sales, then her personal goal for June would be $19,201, or $768 per day.
Again, the easy part is setting the sales goal, the challenge is ‘how’ to achieve it consistently.
Action Steps:
- Calculate the average percentage contribution made by each Month using three years of historical sales data or Industry Benchmarks.
- Divide your annual sales goal by the percentages in Action Step 1 (as per Table 1) to arrive at a monthly goal.
- Get a calendar out and work out the number of days you will be trading/selling in each month.
- Now divide your Monthly goal by the number of trading days (as per Table 2) to arrive at a daily sales goal.
- We recommend you split your sales goal between the sales people so you can manage their activities and measure their results.
- Implement a Daily Team meeting, to keep everyone in the loop and on track.
- ‘TMT’ it. Test Measure and Tune your strategies and results.
The Edge Retail Academy provides customized strategies for retailers and vendors to increase profits, optimize growth, reduce debt, create profitable inventory solutions, build effective teams, and enhance brand loyalty and profitability. The Academy is committed to helping jewelry businesses improve their bottom line while reducing uncertainty and stress. Edge Retail Academy software and business advisors provide real-world knowledge and advice for guaranteed results, all on a “no-contract” basis. Call (877) 569-8657, ext. 1, or email Becka@EdgeRetailAcademy.com or visit www.edgeretailacademy.com.