
Articles and News


How Much Revenue Really Comes From Mobile Shoppers? | June 24, 2014 (0 comments)

New York, NY—Much has been made of the “M” word—mobile—but how many jewelry sales really come from mobile devices?
According to the latest mobile intelligence report from L2 ThinkTank, a New York-based digital marketing consultancy, few companies have hit the tipping point where more traffic and ad revenues come from mobile than desktop. 59% of Facebook’s ad revenues come from mobile, but most brands aren’t there yet.
Mobile still only accounts for one-third of website visits, and while m-commerce may be growing faster than any other online category it still accounts only for a tenth of online retail purchases so far.
All this being said, however, retailers and brands should not dismiss mobile as being too far in the future. Quite the contrary: L2’s research found that most marketers are too focused on sales metrics and don’t pay enough attention to where mobile’s strength really lies at present: greater access and opportunity to influence purchase decisions.
Mobile shoppers spend more than 15 hours a week researching products or services on their devices. Nearly 70% expect an accessible point of sale within five miles of their location and, once they’ve decided to purchase, 55% want to do it within the hour. In short, the focus should be on “mobile-influenced” sales rather than actual mobile sales.
Smart phones and tablets have nearly doubled the time consumers spend connected to the Internet, and as of May 2013, the amount of actual time spent accessing the Web from mobile devices surpassed the time spent accessing it from a desktop. This is a huge opportunity for marketers.
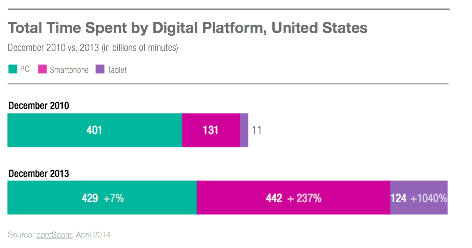
ComScore data shows the exponential growth of time spent on mobile devices. From 2010 to the end of 2013, the amount of time consumers spend on a PC (green bar, including lap and desktop) grew 7%. By contrast, the amount of tme consumers spend on a smartphone (pink bar) grew 237%, and the amount of time spent on a tablet (purple bar) grew 1040%. Image, L2 ThinkTank.
L2 data found that despite clear data showing smart phones are used to assist (though not consummate) purchases, brand investments in site features that benefit brick-and-mortar channels still lag. Almost one-fourth of brands still don’t support click-to-call from store directories, just 65% use geo-location to show nearby stores, and only 12% offer the ability to retrieve current inventory status.
L2’s data covered for main categories: beauty, fashion, watches and jewelry, and retail. Of the four, jewelry and watches lagged behind in its investment in digital commerce overall, though not by as much as it historically has. 69% of jewelry and watch brands were e-commerce enabled, compared with 71% of beauty brands, 88% of fashion brands, and 100% of retail brands studied by L2. But beauty and fashion scored much higher in mobile optimization of their desktop websites, and only 29% of jewelry and watch brands were m-commerce enabled, compared with three-fourths or more of the other categories.
Email on the go. If there is one category where mobile matters most, it’s in email. According to L2’s findings, the greatest percentage of consumers open email on their smart phones. Smart phone email usage grew a whopping 21% year-on-year. These findings emphasize the need for brands and retailers who rely on email as a marketing tool to invest in mobile optimization, such as responsive design, space-efficient navigation, large-format menus, and so forth.
Key tablet optimization tools include both landscape and portrait screen orientation, touch-sized buttons, swipe support, and so forth.
Who’s using what: While smart phone use continues to grow, tablet use is catching up. In 2011, smart phones had a 49% market penetration, and tablets had 20%. Each continues to grow year-on-year, but tablets are growing faster. By the end of 2014, it’s estimated that phones will hit 80% penetration and tablets 64%.
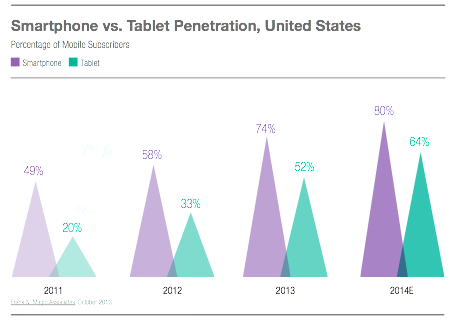
By the end of 2014, 80% of U.S. consumers are likely to own a smartphone (purple pyramid) and 64% to own a tablet (green pyramid). Source: Frank Magid Associates, L2 ThinkTank.
Android has taken over iOS (Apple) as the most widely used operating system in the United States, with 52% share of market vs. 42%. But by category, jewelry and watches skew higher on iOs devices than beauty and fashion—perhaps because Apple is positioned as a luxury brand among electronics, and therefore appeals to luxury jewelry and watch shoppers.
Globally, there’s no contest: Android has 65% share of market vs. iOS ‘s 20%. In the United States, very little share of market is left for any other operating system such as Windows (3%) or all others (3%), while on a global basis, Windows has 8% and other phones capture another 8%.
The brands L2 studied: L2’s research covered 32 fashion brands (such as Chanel, Prada, Tory Burch, Cole Haan, et al), 31 beauty brands (such as Aveda, MAC, Cetaphil, etc.), 34 retail brands (such as Nordstrom, Neiman Marcus, Bergdorf Goodman, LL Bean, and more) and 29 jewelry and watch brands, which included Alex and Ani, Baume & Mercier, Bvlgari, Cartier, Chopard, Citizen, David Yurman, De Beers, Fossil, Harry Winston, Hearts On Fire, Hublot, IWC, Jaeger-LeCoultre, Longines, Mikimoto, Montblanc, Officine Panerai, Omega, Pandora, Patek Philippe, Piaget, Rolex, Swarovski, Tag Heuer, Tiffany & Co., Tourneau, Vacheron Constantin, and Van Cleef & Arpels.
Finally, what do consumers expect when shopping online? Regardless of port of entry—desktop or mobile—consumers have come to expect free shipping and free returns, according to a survey by ComScore and UPS. Many also go online for something they first saw in a store. Read this report in National Jeweler for more information.