Articles and News


Landmark Diamond Market Benchmark Data: How Do Your Sales Compare? | September 12, 2018 (0 comments)
Omaha, NE—How do your diamond sales and profit margins stack up against other jewelers? In a new study of more than 1,000 better retail jewelers across the United States, The Edge Retail Academy has compiled a series of data points outlining year-on-year diamond sales, in both bridal and non-bridal categories, as well as the profit margins on each. These figures represent aggregated sell-through data of more than $1.5 billion in annual jewelry sales, collected from more than 1,000 stores. Each chart reflects an aggregate average per retailer.
Figure 1: Diamond Product Sales (by dollar volume)
Total sales of non-bridal diamond jewelry product rose 8% by dollar volume in July 2018 compared with July 2017. This includes diamond fashion rings, earrings, pendants, necklaces, bracelets, and other non-bridal diamond jewelry.
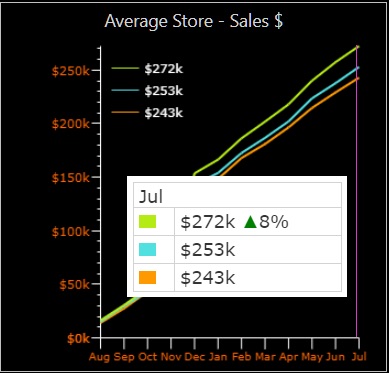
Figure 2: Diamond Product Average Retail Sale (by ticket)
The diamond product average retail sale ticket remained essentially steady year on year (up 1%) from July 2017 to July 2018. The average ticket sale for the past one to 12 months was $1,384; the average ticket for the prior 13-24 months was $1,380. These figures include diamond fashion rings, earrings, pendants, necklaces, bracelets and other non-bridal diamond jewelry.
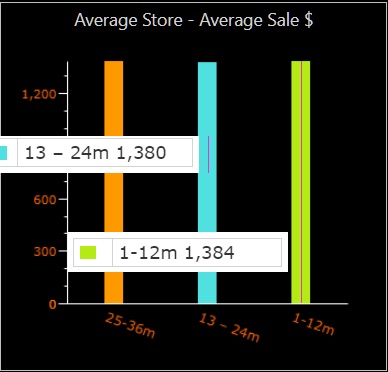
Figure 3: Diamond Product Sales (by units)
Diamond product sales by units are up 7% year on year from July 2017 through July 2018. This includes diamond fashion rings, earrings, pendants, necklaces, bracelets, and other non-bridal diamond jewelry. With the typical ticket remaining steady, these figures suggest more consumers are feeling ready to spend for jewelry.
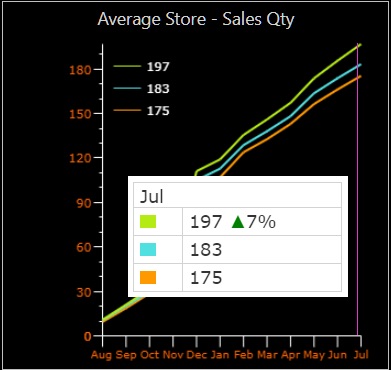
Figure 4: Bridal Product Sales (by dollar volume)
Total sales of bridal jewelry rose an average of 3.9% in July 2018 compared to July 2017. Figures above are an aggregated average of how much each store did in bridal jewelry sales for the month.
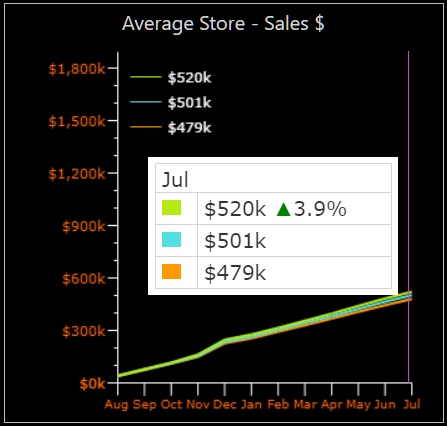
Figure 5: Bridal Product Average Retail Sale (by ticket)
Like non-bridal diamond jewelry, bridal product average retail tickets remained essentially steady (up 1% by value year-on-year) from July 2017 through July 2018. The average bridal ring sale for the past one to 12 months was $2,669, compared to the previous 13-24 months, at $2,668. These figures include diamond engagement rings, diamond wedding bands, loose diamonds, and other diamond rings (i.e. anniversary).
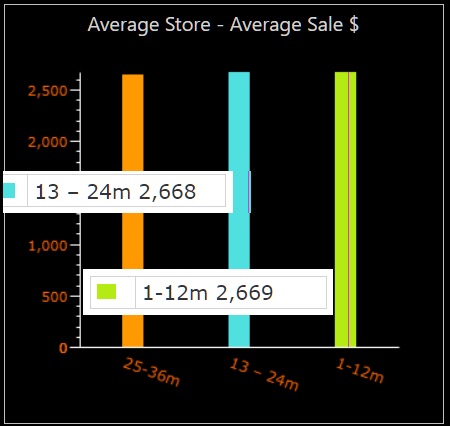
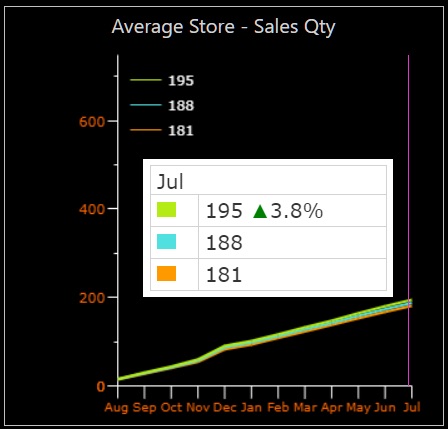
Figure 6: Bridal Product Sales (by units)
Unit sales of bridal product rose 3.8% in July 2018 year on year compared with 2017. This includes diamond engagement rings, diamond wedding bands, loose diamonds and other diamond rings related to bridal or anniversary. The three data points for bridal jewelry sales suggest that increases in the bridal category are coming more from demographics--more consumers are getting married (or at least buying bridal jewelry)--than from a willingness to increase the ring budget.
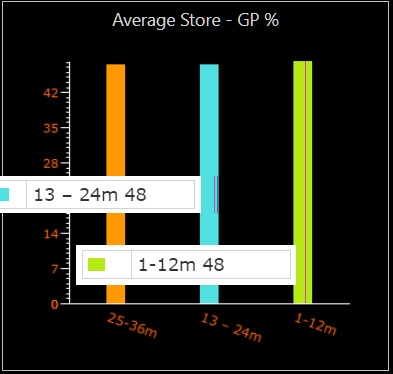
Figures 7 and 8: Gross Margin
Average gross margin--markup--on both bridal and non-bridal diamond product remained steady year on year. Bridal product gross margin (top chart) edged up very slightly: the previous one to 12 months saw an average of 44%, up from 43% for the previous 13-24 months, while non-bridal diamond product remained steady at 48%.
"We love to see our jewelers at 50% or more across the board for all products," says Becka Johnson Kibby, director of operations for The Edge Retail Academy. A lot of jewelers don't get margin on bridal or diamond sales, so they have to make it up elsewhere, she said.
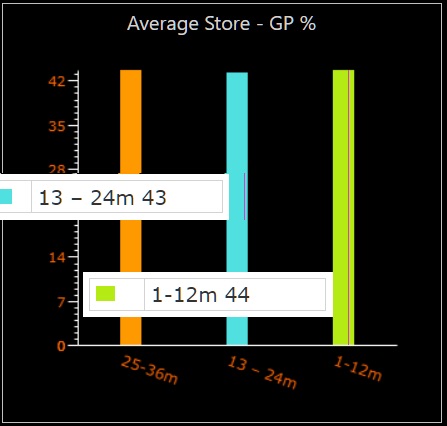
Above: Bridal product gross margin; below, non-bridal diamond product.
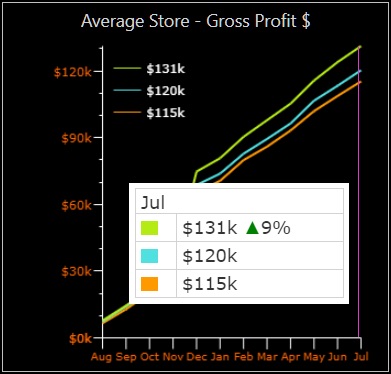
Figures 9 and 10: Gross Profit Dollars
Good news for jewelers' bottom line: while prices and margins may not have increased significantly year-on-year, gross profits for both bridal (top chart) and non-bridal diamond product (bottom chart) have increased--suggesting retailers are finding better and more effective ways to manage both categories.
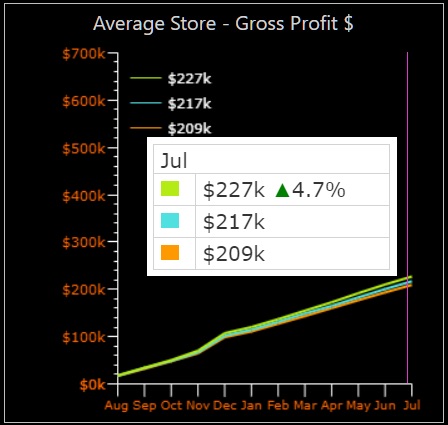
Profits from bridal product is up 4.7% year-on-year from July 2017 to July 2018, and profits from non-bridal diamond product is up almost double, a full 9% year-on-year.