
Articles and News


JSA: Total Crime, Homicides, and Residential Crime Up in 2017, But Still Much Lower Than Peak March 21, 2018 (0 comments)

New York, NY—The total number of crimes committed against U.S. jewelry firms and reported to the Jewelers Security Alliance increased 12% in 2017 over 2016, but the total dollar losses from those incidents decreased slightly, 0.4%.
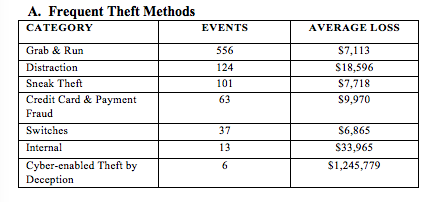
These figures include robberies, burglaries, and thefts. JSA defines robbery as taking property by use of force or fear; burglary as entering premises after closing with intent to commit crime; and theft as taking of property without force or fear, including fraud, distraction, diamond switches, and so forth.
One figure to note: among all crimes classified as thefts, cyber-enabled theft presents the greatest opportunity for loss to jewelers. Although there were only six such incidents last year, the average loss per incident was a whopping $1.2 million—compared to other types of thefts where the average losses ranged from about $7,000 per incident to about $34,000 per incident, the next-highest loss average—and that figure was for internal theft. Cyber-enabled theft by deception is clearly a growing risk for jewelers.
Sadly, homicides were up slightly in 2017. Seven people were killed during jewelry crimes last year, compared to six in 2016 and two in 2015. Five of the seven victims killed last year were retail jewelers. One customer and one “good Samaritan” also were killed in the process of a jewelry crime. A spot of good news, however: no traveling salespeople or law enforcement officers died in jewelry crime last year.
While the total number of robberies increased 12.1% year-on-year, the good news is that robbery events with violence were down 3.9% from the prior year and, specifically, robbery events involving a gun were down 11.8%. Guns were used in just under half of all robberies in 2017.
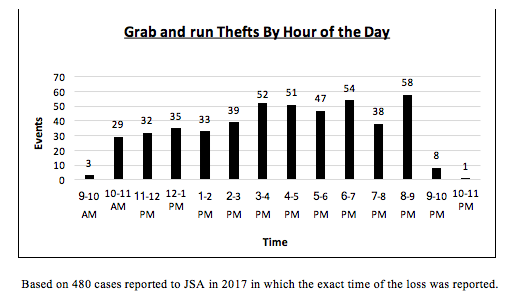
Smash-and-grab robberies increased 14.5% year-on-year, from 62 events in 2016 to 71 events reported to JSA in 2017. The majority of those (37) occurred in mall stores; the fewest (5), in strip centers. 14 smash-and-grab events occurred in downtown stores and 15 in standalone stores. January and November had the most smash-and-grab events (10 each) and June had none. Thursdays and Fridays were the biggest days for these events; Saturdays and Sundays the least likely for an occurrence. Just before lunch and just before closing were the most common times for them to occur.
Dollar losses from burglaries decreased a whopping 45.4%, the frequency of attacks on safes dropped 9.5%, and so-called “three-minute burglaries,” were down 18.7%. B3Ms, as JSA calls them, can happen only when merchandise is left unsecured overnight.
Off-premises crime events decreased by 18.8% last year vs. 2016, but the total dollar losses from off-premises crime increased 39.2%. The overwhelming majority of victims were traveling jewelry salespeople and trunk show personnel. Parking lots and streets/highways remained the most likely place for off-premises crime to occur, at 28% and 25%, respectively, but a very worrisome trend was a sharp increase in the number of crimes committed at the victim’s residence—17% of all off-premises crime in 2017, vs. 6% in 2016.
Despite the increases of crime incidents last year, the overall trend in crime is highly positive: i.e. there’s much less crime than there used to be. For instance, in 1999, total industry dollar losses from crime peaked at $199.7 million, compared to $72.1 million in 2017 (both figures reported in 2017 dollars). That’s a drop of almost two thirds (63.9%). Traveling salesperson losses were the lowest in 20 years: only 39 incidents of crimes against traveling salespeople were reported to JSA last year, compared to a high of 323 in 1999. Even deaths are down: while 2017 was not the lowest recorded (that was 2007, with one death), it’s far fewer than the peak of 15 in 1996, 11 in 1997, 12 in 2002, and more. Deaths of jewelry industry personnel from 2007 forward were exactly half of total deaths from 1996 to 2006.
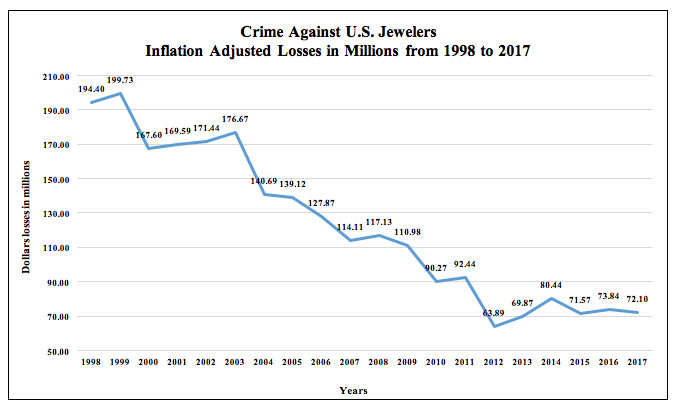
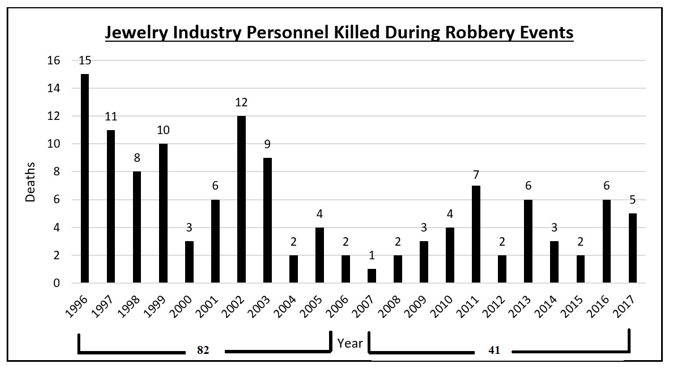
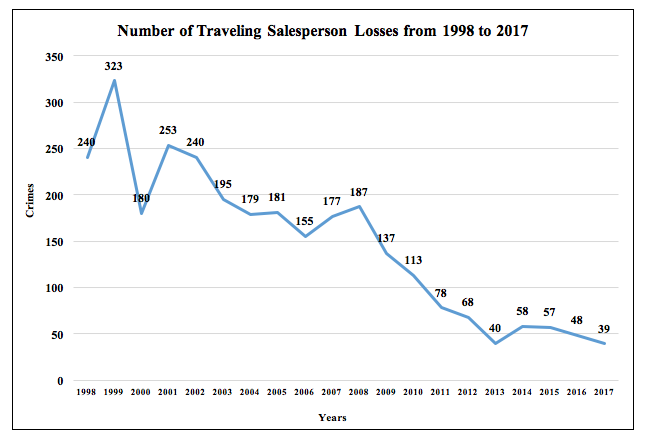
All charts, JSA.