
Articles and News


THE GOLD PRICE PLUNGE: A BURST BUBBLE OR A SHORT-TERM CORRECTION? | April 17, 2013 (0 comments)
Merrick, NY—Like the first drop on a rollercoaster, there’s nothing like a sharp decline in gold to get the heart pounding and blood racing. In just two days of trading (Friday, April 12 and Monday, April 15), gold and silver dropped to two-year lows; gold in particular dropped by $175 the ounce, and silver, $4.00 the ounce.
Is this the sign of a burst bubble—where prices could plummet below $1,000 in the next two or three months—or is it a correction, where prices temporarily bottom out around $1,200 before resuming a gradual upward climb?
While last Friday’s and Monday’s trading certainly triggered thoughts of the “b” word, by Tuesday morning, gold was posting solid gains from its 26-month low of $1321.50.
At presstime, gold was trading at $1,382. And not everyone believes it was in a bubble to begin with. Prices rocketed between 2010 and 2012, but still didn’t show the parabolic increases two other famous bubbles—the housing market and the NASDAQ—did. Still, it may be more semantics than anything else.
While nobody can predict what the price of the metal will do from here, some keys and indicators can give clues to what might happen. Andy Waldock, founder of Sandusky, Ohio-based Commodity and Derivative Advisors, says [trading] volume has spiked, and that’s a good place to start observing, as it means more action at these price levels.
For example, on Thursday, April 11th, the gold market traded a total of 141,403 contracts. On Friday, April 12, it traded 368,559. On Monday, April 15, it traded 704,158. This puts the total traded for the week at over one million contracts.
To put that figure into perspective, Waldock says there have only ever been five weeks in history where more than 1.2 million contracts were traded. The record is 1.7 million in a week, which occurred in September 2011 as the market was peaking over $1,900. And the first-ever million-plus week occurred only three years earlier, in 2008, which coincided with the first pullback in price from $1,000/oz. to $732/oz on October 24 of that year. But by September 2011, gold had peaked to $1,948. This week’s pullback was almost exactly half of that rally, he observed.
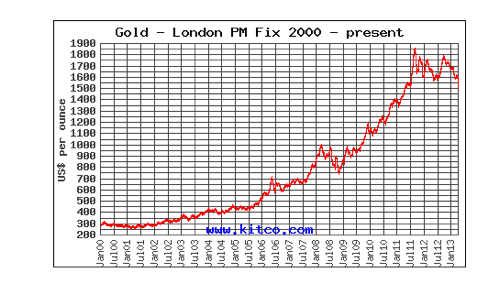
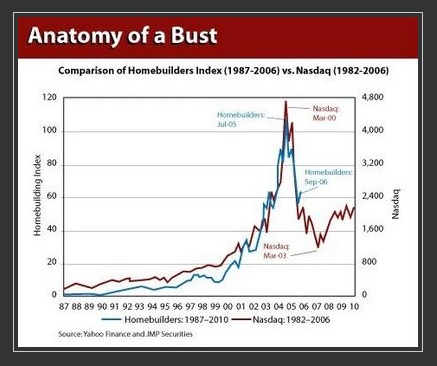
The top chart, from Kitco.com, shows the progression of gold prices every six months from January 2000 to January 2013. While the period from January 2009 through July 2011 shows a sharp bull market, it still doesn't reflect the dramatic parabolic increase that both the housing market and the NASDAQ did, as shown in the bottom chart, from Economic Edge.
“Nobody knows how low it’s going to go, and anyone who gives a figure is just guessing,” says Jim Wyckoff, a contributing analyst to Kitco.com. But his own guess is that the majority of movement has already occurred: from Friday to Monday, the market saw the steepest drop of the past 30 years, and he doesn’t see that continuing at the same rate.
“We may see more drops, but they won’t be as steep. If the market closes on Friday at or near the high price of the week, that is a clue that the market bottom has occurred,” Wyckoff told The Centurion. Likewise, if the Friday close is near the weekly low, it too could be a harbinger of future prices, he said in his Tuesday morning Kitco report.
But in another report, Shaun Osbourne, chief FX strategist for TD Securities, says any rebound in gold is likely to be in the $1,450 to $1,500 area, noting $1,500 as an area of stiff resistance. Waldock says his initial target of $1,442 takes the market halfway back to last Thursday’s close, and he is watching that level closely.
“It should be where the battle is fought, and we find out for sure whether this is a correction or the beginning of a deflationary trend,” he told The Centurion.
Osbourne, meanwhile, told Kitco he thinks gold could eventually fall as low as the $1,150 to $1,250 range. But other analysts don’t see it going quite that low. For example, Global Hunter Securities has lowered its gold price forecast for 2013 to $1,475; like Wyckoff, the firm believes the metal has passed through the eye of the storm and is seeing more calm ahead. It pegs the $1,600 mark for 2014. And Dr. Damir Tokic, owner of Macrotheme Capital Management LLC and a contributor to the financial website Seeking Alpha, believes the price of gold is currently in a correction, not a bubble burst.
Przemyslaw Radomski of Sunshine Profits.com believes there are two key thresholds to watch, $1,300 and $1,100. “In my opinion, gold is very likely to bottom close to one of these two levels. If the first is broken, we will quite likely see $1,100 or so,” he told The Centurion. “But my take is that gold will not stay this low for long—a few months at most, and then the bull market will continue.”
There’s no single force driving the market down; rather, a series of events are making gold investors nervous. Disappointing economic numbers from China last week spooked markets, as did reports that financially troubled Cyprus—and possibly some other financially strapped European nations—may sell off some gold reserves to help finance their bailouts from the European Central Bank and the International Monetary Fund. There also have been indications that the Fed may gradually end quantitative easing. But other factors are at work too, including issues in the mining sector, and Radomski says in the months prior to last Friday’s decline, gold had bottomed twice near $1,520, and that became a level of critical support.
“When price moved below this level, it most likely triggered many stop-loss orders, which took gold tens of dollars lower, and at that time panic started. People saw gold broken below the 2011 and 2012 lows and started selling. This caused lower prices, panic of other investors, further selling, and so on.”
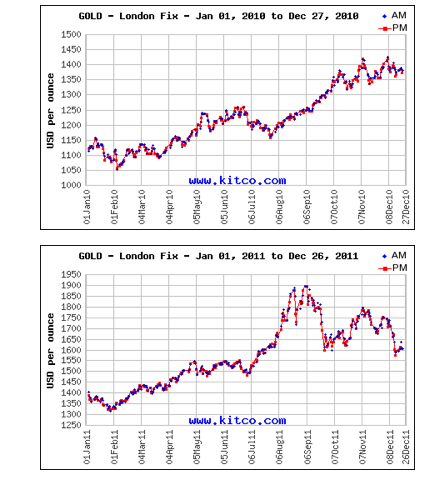
The top chart shows gold in 2010; a gradual but fairly steady climb up. The bottom chart shows gold in 2011; again, fairly steady until August and September, when it shot up to $1,900 before falling back down around $1,600. We begin to see more up-and-down volatility after that. Charts: Kitco.com.
Additionally, investors have been shifting back into stocks from gold. Lately the stock market has looked like a better bet than gold, says Waldock. Gold decoupled from the stock market late last year; the S&P is up 15% while gold is down more than 10%, he told The Centurion. (Read more about the relationship of gold and the stock market here).
Gold is traditionally a safe haven investment, reminds Wyckoff, while investors look at the stock market as a risk asset. But when there’s good economic news, they’re more comfortable with risk—which in essence means a drop in gold is really good news because it implies a better economy, which in turn improves consumer willingness to spend.
The bottom line total of their personal investment portfolio is far more likely to influence consumers’ buying behavior than the price of gold, says industry analyst Ken Gassman. While the gold market’s nosedive has speculators who bought paper gold (ETFs, futures, etc.) licking their wounds, Wyckoff feels it presents a good opportunity for those who buy physical gold.
“I think this downturn will be a value opportunity. Nobody knows how low it will go, but these [drops] occur only a few times in a decade,” says Wyckoff. If you’re an end user, it can be a great opportunity to buy, he says. Overnight, demand for physical gold—both bars and jewelry—in China, Asia, and India spiked, and some retail stores there were sold out, he said. Bargain hunters already were flooding the market here by Tuesday morning, and prices had rebounded off the sharp drops of Friday and Monday.
Radomski agrees that buying gold at depressed prices can be a good opportunity to increase profit margins, but warns not to put operating capital at risk or invest more than you can afford to lose.
“[Companies should] estimate how much money they can dedicate to lose without impacting their business in a major way, and name that part of their cash reserves ‘investment capital.’ Develop a strategy of how much money they can dedicate to investment or speculation in gold and silver prices, and then stick to this strategy. Be aware that investing in gold is investment, not an operational activity.”
He also strongly urges anyone who is considering investing in gold to use a good professional analyst or investment advisor.
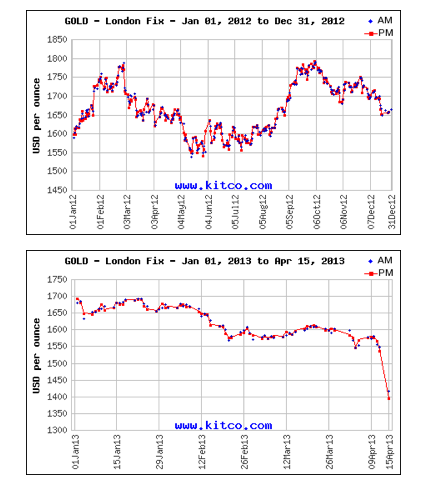
Tracking the gold price throughout 2012 (top chart), we see more up-and-down volatility than in 2010 or most of 2011. The increase in volatility began in Q4 2011 and continued through 2012. We begin to see declines in October 2012, continuing into 2013 (bottom chart) with a gradual slide down until we see last week's sharp drop. Charts: Kitco.com.
Questions at the counter. Meanwhile, what can jewelers say to customers who might ask about gold prices?
For one thing, it’s temporary. How long prices remain down (or up) is unknown, but markets don’t change, Wyckoff says. They behave in a certain way, and if you look at this situation from a historical perspective, these things happen, he says. But gold will come back into favor [as an investment, driving prices back up].
“Historically, gold has been the most desired and prized of metals, both for adornment and for the conveying of deep emotional communications,” says Sally Morrison of the World Gold Council. “This love affair with gold goes beyond any short term market fluctuations.
“While consumers in India and China are more immediately sensitive to changes in market price because retail prices there are more closely tied to bullion prices, we do not expect that U.S. consumers would expect a price decrease in response to this short term pullback,” she added.
Gassman agrees that luxury jewelers should focus on selling jewelry, not gold. Yes, the product has intrinsic value, but don’t get caught up in the market data. Sell the emotion, craftsmanship, design, and beauty of a piece—just like this industry has always done.