Sales Strategy
Holiday 2019: A Few More Key Sales Metrics From Better Jewelers | January 01, 2020 (0 comments)

Merrick, NY—2019 was the strongest sales season in recent history for better jewelers. More than 80% of respondents to The Centurion’s 2019 Holiday Sales Success Index spot-check survey found experienced sales growth this season. That's the most jewelers reporting an up season since 2012. 38% of 2019 respondents experienced growth of more than 10% year-on-year over 2018. Here are a few additional metrics from our survey that can help better jewelers with merchandising and planning in 2020.
Related: For Luxury Jewelers, Holiday Season Wraps On High Note But Millennials Not Impressed
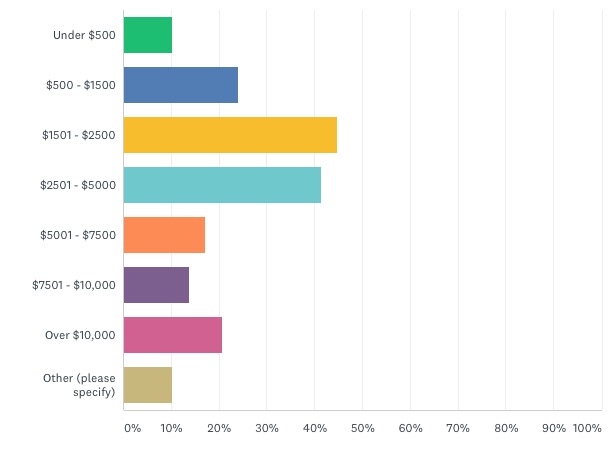
As reported in our season wrapup, diamonds and Rolex watches both kept their titles as the top sellers for the season, but we also saw strong performance from private label, estate, and custom jewelry and pre-owned watches. Best-selling price points for the season sat in the $1,500 - $5,000 range (a sweet spot for female self-purchase as well), but an impressive 21% of respondents said they did very well with unabashed luxury: price points above $10,000. (Note: Respondents were asked to check all that apply, so totals exceed 100%).
What Were Your Best-Selling Price Points For The 2019 Holiday Season?
Despite multiple reports of the bridal market shrinking, 22% of Centurion respondents said they sold more bridal jewelry this year than last year or even in the past five years. But 15% of respondents said bridal sales were way down from other holiday seasons.
15% of respondents said there were no standout shifts in business this year; the product mix of what sold remained consistent with prior years. Other notable trends among respondents were an increase in women shopping (responses didn’t break out if they were self-gifting or buying for others), but jewelers also noted a corresponding increase in gold, fashion, designer, color, and pearl pieces; all things that women often do buy.
Finally, there were some noteworthy shifts in shopping patterns this year vs. 2018. 45% of respondents reported fewer shoppers but bigger tickets in 2019 vs. 2018 (green bar). Last year, after the 2018 holiday season, 31% observed that trend against 2017. By contrast, very few (6%) respondents said they had higher volume with smaller tickets in 2019 (blue bar), whereas last year about 14% of respondents reported increased volume of smaller sales compared to prior years.
Perhaps owing to the shortened time between Thanksgiving and Christmas, this was a very late season for upscale jewelers: 41% said people shopped later than usual this year (pink bar), a trend borne out by The Centurion’s initial 2019 season surveys. And 27% of respondents this year experienced a big last-minute rush, compared to 17% last year. About one third said both traffic and tickets were up (yellow bar) but this year nobody said that both were down.
How Would You Categorize Shopping Patterns This Season?
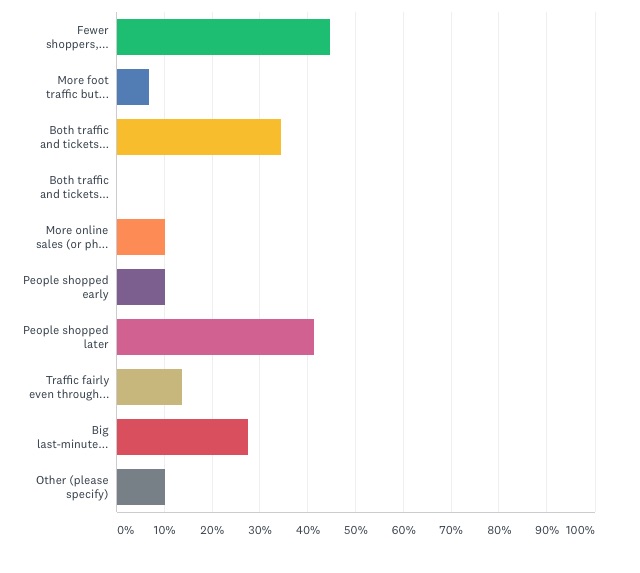
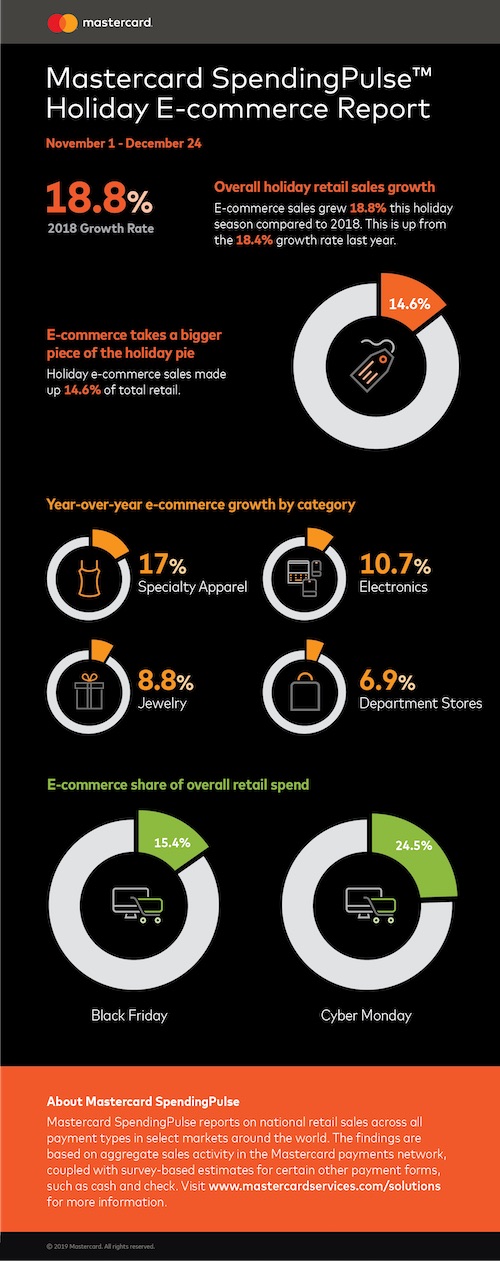
Finally, about 10% of respondents identified more sales coming from their website, whether directly transacted online or telephone orders resulting from something seen online (orange bar). Last year, fewer than 3% identified this as a growing area. These results also track with the findings of Mastercard SpendingPulse (below), which pegged holiday e-commerce growth in the fine jewelry overall (both luxury and nonluxury) at 8.8%.
