
Articles and News


HOW TO USE FREE GOOGLE TOOLS TO ANALYZE AND IMPROVE YOUR WEB PERFORMANCE | August 24, 2011 (0 comments)

The fourth installment of The Centurion's exclusive digital marketing series gives step-by-step instructions for evaluating how well your website is performing.
Las Vegas, NV—Say “Google,” and most people immediately think of its search engine. I still remember the day years ago that my daughter came home from elementary school and said she was going to look something up on Google.com. I figured with a name like that, it was a cute kids’ site.
Was I wrong! Google now powers over 60% of the search traffic on the Internet. But it also offers an entire portfolio of powerful tools to help you track your website visitors and, if you want, also to schedule your time, and pretty much manage your life.
Google’s tools include everything from Google Base (where you can list and search for products to buy) to Google Health (track your medical records online) to Google Analytics and Webmaster tools, the focus of this article, which allow you to monitor your website health and traffic. All these tools, by the way, are absolutely free.
These are the tools critical to monitoring your website and Internet presence:
- Google Webmaster Tools
- Google Analytics
- Google Cache/Text-Only versioning
Google Cache/Text-Only Versioning. In our last installment, we discussed Flash technology and the importance of seeing your website the way Google does. The easiest way to do that is to look at a cached version of your website, and then view it as ‘text-only.’ Remember that Google can only read text, not images, so the text is critical.
To see what your website looks like to Google, follow these steps:
- Go to www.Google.com
- Enter your website address into the search field (ex: www.FocusBMI.com), and search
- When the results show, there should be a small link that says ‘cache’ next to your listing. Click that link and a new browser tab/window will open. This is the most recent indexing of the website that Google has in its database.
- In the top right corner you will see a link that says ‘text-only version’. Click that link and the page that you are viewing will change to only the text that Google can read. If you are using a site with a lot of images or Flash technology, there will be very little on this page. If you are using a well-constructed page, you will see a lot of text that will assist in the Google indexing process.
If you do these steps and find that your site is nearly blank, talk to your web developer to see how you can get more readable text on your page.
Google Webmaster Tools. You’ll be blown away by how much information Google is able to collect and provide to users for free. The webmaster tools are designed to help the person administering your website understand the functionality of your site. It identifies items like:
- Broken or bad links
- Duplicate content in your meta tags (keywords, descriptions and titles)
- How often Google is searching the site
- What internal and external pages are linking to your site
It also lets you upload and identify where your sitemap is located (so Google can easily index your site)
By simply uploading a small file on your server (to prove to Google that you are truly the owner of the site), you can access all of this information.
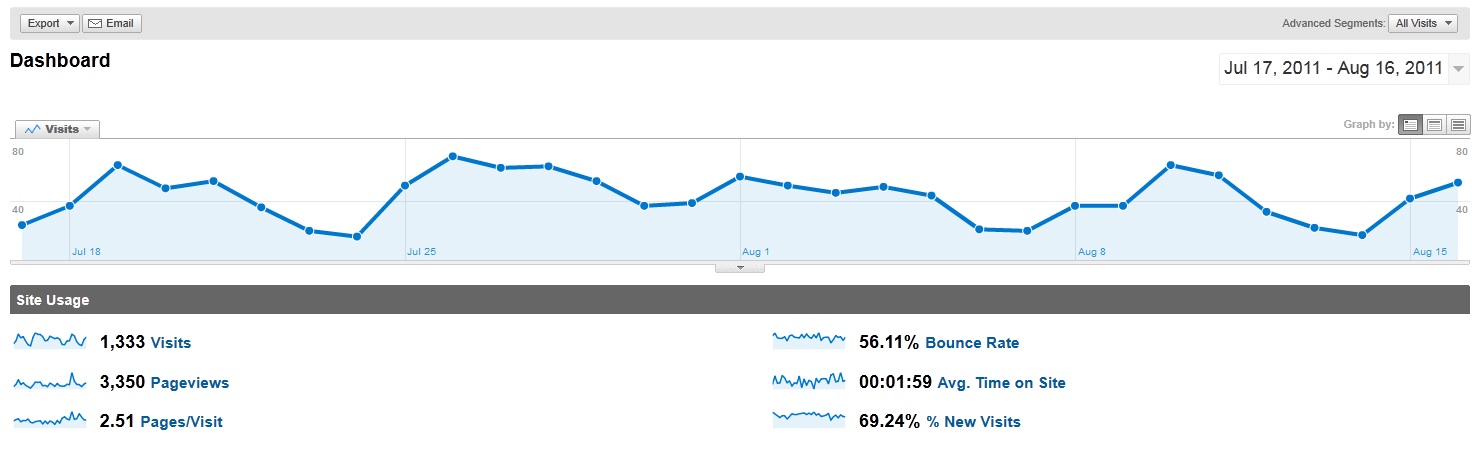
Google Analytics. The webmaster tools are powerful, but they are typically reserved for the tech-y people who are running the back-end operations of the website. But the most powerful tool that can easily be used by the store manager is Google Analytics. The analytics section shows you, in excruciating detail (if desired) who is visiting your site and how they got there. With Google Analytics you can track:
- The number of visits to your site (broken down to new and returning visitors)
- How long visitors stay on your site (and from which pages they leave your site)
- What keywords they used to find your site
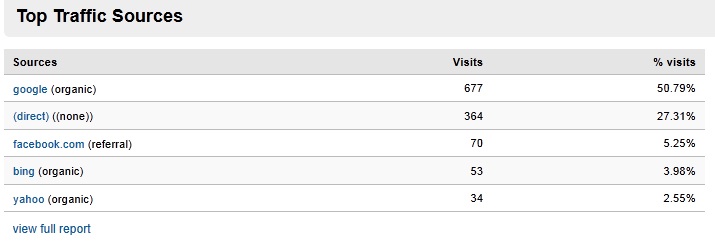
- How they found your site (direct, search engines, referrals, Adwords, etc.)
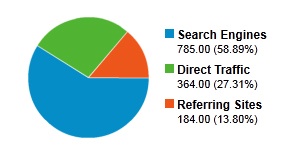
One tool you can use is a graph showing how people arrived at your site: direct, referral, or search
Additionally, you can track what kind (and version) of browser they are using, what the screen resolution is that they are using to view the site, what their Internet speed (bandwidth) is, et cetera. The amount of detail is overwhelming, but useful in helping you design a site better suited to users. For example, if your users have lower-resolution screens or slow Internet speed, very high resolution photography—though beautiful—will take a long time to load, risking users leaving the site. Conversely, if your users overwhelmingly have state-of-the-art browsing capability, you may want to up the ante on photography, especially for e-commerce sections of your site.
The four items bulleted above are the key elements you can review to better understand who your Internet customers are. Are they new customers or returning customers? What keywords did they use to find your site? Were they referred from some other site or did they find you via search? By knowing these types of items, you can start to adjust your marketing campaigns accordingly.
If you know that they are coming from a referral source you can start to investigate getting more links to that source. For example, if Twitter is driving a lot of traffic, increase the frequency of your Tweets. If they are reaching your site using the phrase “new jersey engagement rings,” be sure that you use that specific term in a few of your blog posts or Tweets. Google likes it when it can find exact matches for phrases. Also, if you find that one of your pages really seems to have a high rate of exits (people leaving the site), then you may want to reconsider the verbiage or load time on that page.
By having your webmaster install one snippet of code on your site (that you will copy from your Google Analytics account), you can begin tracking and analyzing all of this data. But the key to using this data is to review and analyze only that data for which you have a defined plan. If you start digging too deep into the analytics you can become overwhelmed and lose focus on the big picture. Stay within the top two levels of detail, and you should be able to find the information you need to make your business decisions.
Here are examples of two more analytics. Top, a graph showing daily visits to a website:
Below is a sample graph showing the top referring sites to a website:
Other visual analytics you can use include a graph showing the top search terms for the website, graph of search query analysis from Webmaster Tools, and much more.
Jeffrey W. Arnold is a business consultant for Focus Business Management Institute an industry leader in retail jewelry consulting. Arnold has helped increase the profitability of numerous companies, ranging from start-ups to multi-billion-dollar entities. He now conducts social media and Internet marketing seminars for retail jewelers and leads the marketing initiatives for Focus. For more information on Focus and how they help increase profitability for independent jewelers, visit www.FocusBMI.com