
Articles and News


Better Jewelers’ Diamond Sales Up 8% Through Summer | October 17, 2018 (0 comments)
Omaha, NE—Sales of non-bridal diamond jewelry were up 8% year-on-year through August 2018, and sales of diamond bridal jewelry grew 4.1% through August. These figures, compiled by The Edge Retail Academy, represent aggregated sell-through data for more than $1.5 billion in annual fine jewelry sales at more than 1,000 better retail jewelers across the United States.
August’s 8% increase in non-bridal diamond jewelry sales applied equally to dollar volume and unit sales, vs. the same period in 2017. The average retail ticket for the category again remained essentially steady—just an incremental drop from an average of $1,397 to $1,394 per sale in the past 12 months.
Related: Landmark Diamond Market Benchmark Data: How Do Your Sales Compare?
Figure 1: Non-Bridal Diamond Product Sales By Dollar Volume (top) and Units (bottom):
Diamond sales for the average better U.S. jeweler were up 8% in August, both in dollars and units. Figures for 2016-2017 are shown by the aqua line and figures for 2015-2016 are shown by the orange lines.
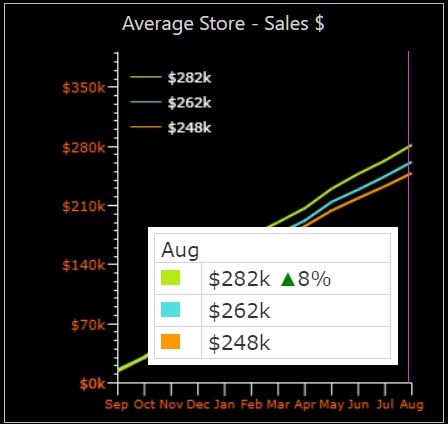
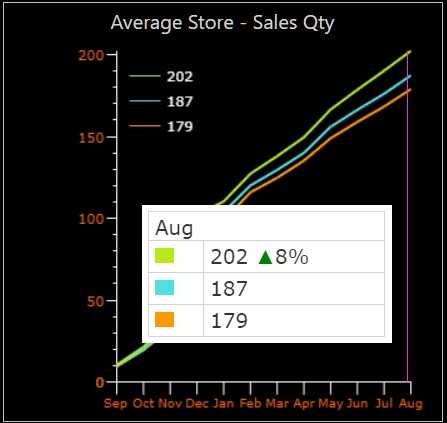
Figure 2: Bridal Product Sales By Dollar Volume (top) and Units (bottom)
Bridal sales grew slightly more by dollar volume (4.1%) than unit sales, which edged up 4.0% year-on-year in August (green line). 2016-2017 figures are represented by the aqua line and 2015-2016, by the orange line.
The average bridal ticket edged up incrementally (1%) year-on-year for the same period, from $2,672 to $2,673. Figures include data for engagement rings, wedding bands, other diamond rings, and loose diamonds.
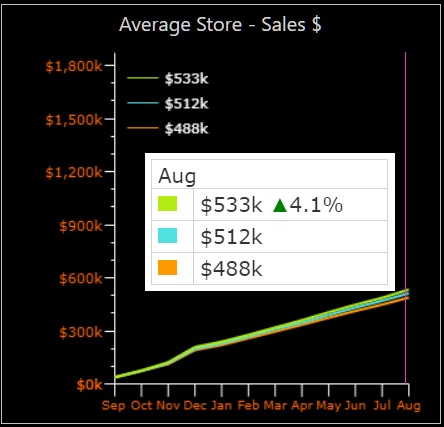
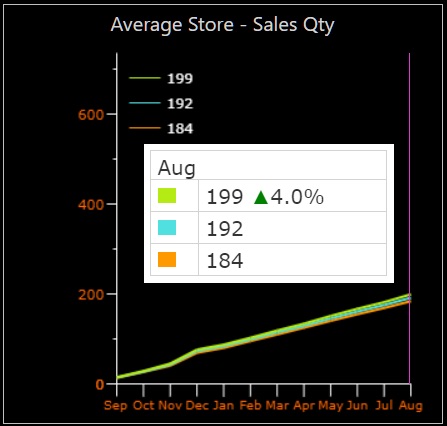
Figure 3: Gross Profits On Non-Bridal (top) and Bridal (bottom) Diamond Product
Good news for jewelers: gross profits on diamond jewelry continue to rise. Non-bridal diamond jewelry profits (top chart below) were up 10% year-on-year in August, rising yet another percentage point from July’s 9% YOY gain. Bridal jewelry profits were up 5% year-on-year for August, compared to a 4.7% YOY gain in July.
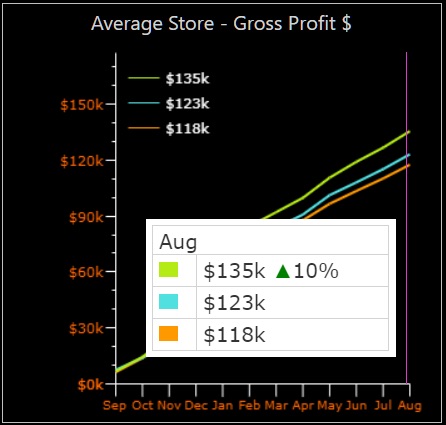
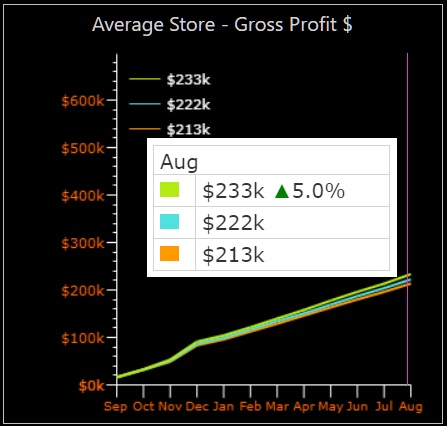
Figure 4: Gross Margins For Bridal (left) and Non-Bridal (right) Diamond Product:
Gross margins—i.e. markups—remained unchanged from July, thought they edged up incrementally from 2017.
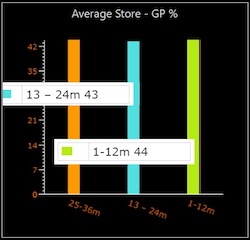
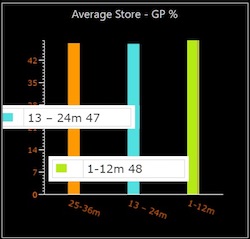
Margins in both bridal (44%) and non-bridal (48%) diamond categories remain below what Edge Retail Academy’s experts like to see. Ideally, says Becka Johnson Kibby, The Edge’s director of operations, retailers will get at least a 50% markup across the board on everything. But reality is another story: it’s a challenge to get 50% on bridal and other diamond products, as well as some brands (all of which are the most competitively shopped) so jewelers need to make up those differences in other areas, she said.
The areas they’re most likely to make it up are silver, gold, and colored stone and pearl jewelry, all of which are averaging over 50% margin at U.S. better jewelers: silver and gold average 53% respectively and colored stone jewelry, 52%. “This can differ from store to store, but we look at the overall margin and specific margins in each category to help retailers get an overall margin that is at least 50%, but we prefer it to be higher, of course,” says Kibby. The Edge’s sell-through data shows these categories have remained steady for the past 36 months.
Top image: Forevermark by Rahaminov diamond wing earrings.